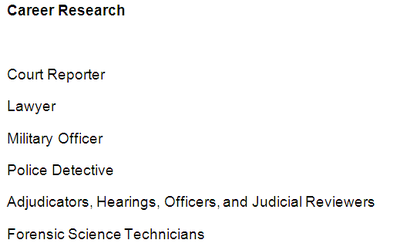
Career Research
a. Describe what you had to do in the assignment.
Get information on eight jobs I would want to do.
b. Describe the technology skills you had to use to complete this assignment.
Creating graphs in Microsoft Office.
c. Describe what you learned and accomplished by creating this piece of work.
I learned how to chart data in Microsoft Documents.
d. Explain what you did well in this assignment?
I think I did well with setting up the data in charts.
e. Explain what you would do differently to improve your work in this assignment?
I believe i need to improve on the amount of data I have in the file.
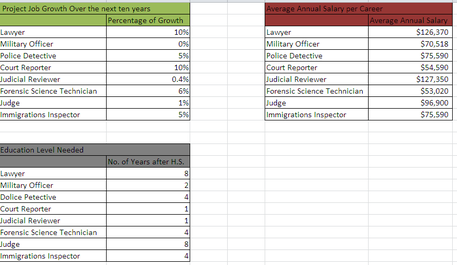
Career Data Excel Charts
a. Describe what you had to do in the assignment.
I created charts in Excel for the jobs I chose in the Career Research project.
b. Describe the technology skills you had to use to complete this assignment.
Graphing and charting in Excel.
c. Describe what you learned and accomplished by creating this piece of work.
I found out how to create charts and data graphs in Microsoft Excel.
d. Explain what you did well in this assignment?
I think I did well with organization of the data.
e. Explain what you would do differently to improve your work in this assignment?
I believe I could try to Improve the looks of the graphs and charts.
